Flight Instruments
| Sito: | PPL (A - H) - Quiz Licenza di Pilota Privato |
| Corso: | PPL (A - H) - Quiz Licenza di Pilota Privato |
| Libro: | Flight Instruments |
| Stampato da: | |
| Data: | giovedì, 21 novembre 2024, 11:04 |
Descrizione
Sommario
- 1. Flight Instruments
- 1.1. Pitot-Static
- 1.2. Pitot-Static - Altimeters (Part One)
- 1.3. Pitot-Static - Altimeters (Part Two)
- 1.4. Pitot-Static - Vertical Speed (VSI) and Airspeed (ASI) Indicators
- 1.5. Pitot-Static - Blockage of the Pitot Static System
- 1.6. Electronic Flight Display (EFD)
- 1.7. Gyroscopic Flight Instruments (Part One)
- 1.8. Gyroscopic Flight Instruments (Part Two)
- 1.9. Gyroscopic Flight Instruments (Part Three)
- 1.10. Angle of Attack Indicators
- 1.11. Aircraft Compass Systems (Part One)
- 1.12. Aircraft Compass Systems (Part Two)
Flight instruments enable an Aircraft to be operated with maximum performance and enhanced safety, especially when flying long distances. Manufacturers provide the necessary Flight Instruments, but to use them effectively, Pilots need to understand how they operate. As a Pilot, it is important to become very familiar with the operational aspects of the pitot-static system and associated instruments, the vacuum system and associated instruments, the gyroscopic instruments, and the magnetic compass.
- Pitot-Static Flight Instruments – Impact and Static Pressure Chambers and Lines
- Pitot-Static Flight Instruments – Altimeters (Part One)
- Pitot-Static Flight Instruments – Altimeters (Part Two)
- Pitot-Static Flight Instruments – Vertical Speed (VSI) and Airspeed (ASI) Indicators
- Pitot-Static Flight Instruments – Blockage of the Pitot Static System
- Electronic Flight Display (EFD)
- Gyroscopic Flight Instruments (Part One)
- Gyroscopic Flight Instruments (Part Two)
- Gyroscopic Flight Instruments (Part Three)
- Angle of Attack Indicators
- Aircraft Compass Systems (Part One)
- Aircraft Compass Systems (Part Two)
Pitot-Static Flight Instruments
The pitot-static system is a combined system that utilizes the static air pressure and the dynamic pressure due to the motion of the aircraft through the air. These combined pressures are utilized for the operation of the AirSpeed Indicator (ASI), Altimeter, and Vertical Speed Indicator (VSI). [Figure 1-1]
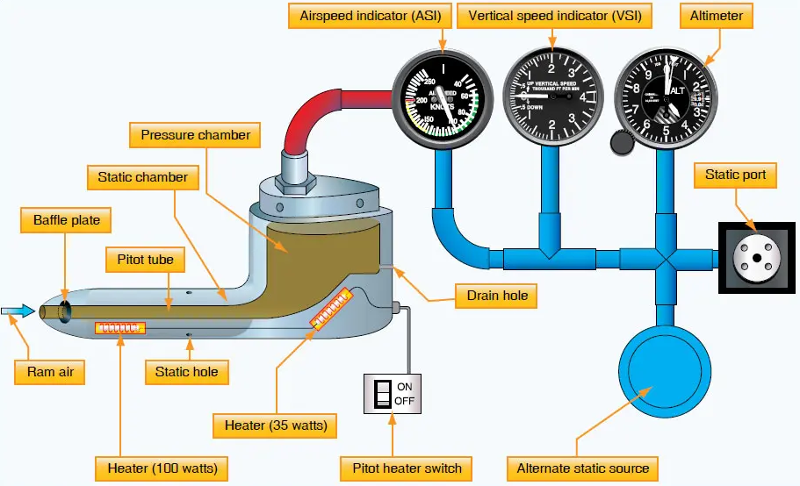
Impact Pressure Chamber and Lines
The pitot tube is utilized to measure the total combined pressures that are present when an aircraft moves through the air. Static pressure, also known as ambient pressure, is always present whether an aircraft is moving or at rest. It is simply the barometric pressure in the local area. Dynamic pressure is present only when an aircraft is in motion; therefore, it can be thought of as a pressure due to motion. Wind also generates dynamic pressure. It does not matter if the aircraft is moving through still air at 70 knots or if the aircraft is facing a wind with a speed of 70 knots, the same dynamic pressure is generated.
When the wind blows from an angle less than 90° off the nose of the aircraft, dynamic pressure can be depicted on the ASI. The wind moving across the airfoil at 20 knots is the same as the aircraft moving through calm air at 20 knots. The pitot tube captures the dynamic pressure, as well as the static pressure that is always present.
The Pitot Tube has a small opening at the front that allows the total pressure to enter the pressure chamber. The total pressure is made up of dynamic pressure plus static pressure. In addition to the larger hole in the front of the Pitot Tube, there is a small hole in the back of the chamber that allows moisture to drain from the system should the aircraft enter precipitation. Both openings in the Pitot Tube must be checked prior to flight to ensure that neither is blocked. Many aircraft have Pitot Tube covers installed when they sit for extended periods of time. This helps to keep bugs and other objects from becoming lodged in the opening of the Pitot Tube.
The one instrument that utilizes the Pitot Tube is the ASI. The total pressure is transmitted to the ASI from the Pitot Tube’s pressure chamber via a small tube. The static pressure is also delivered to the opposite side of the ASI, which serves to cancel out the two static pressures, thereby leaving the dynamic pressure to be indicated on the instrument. When the dynamic pressure changes, the ASI shows either increase or decrease, corresponding to the direction of change. The two remaining instruments (altimeter and VSI) utilize only the static pressure that is derived from the static port.
Static Pressure Chamber and Lines
The static chamber is vented through small holes to the free undisturbed air on the side(s) of the aircraft. As the atmospheric pressure changes, the pressure is able to move freely in and out of the instruments through the small lines that connect the instruments to the static system. An alternate static source is provided in some aircraft to provide static pressure should the primary static source become blocked. The alternate static source is normally found inside the flight deck. Due to the venturi effect of the air flowing around the fuselage, the air pressure inside the flight deck is lower than the exterior pressure.
When the alternate static source pressure is used, the following instrument indications are observed:
-
The altimeter indicates a slightly higher altitude than actual.
-
The ASI indicates an airspeed greater than the actual airspeed.
-
The VSI shows a momentary climb and then stabilizes if the altitude is held constant.
Each Pilot is responsible for consulting the Aircraft Flight Manual (AFM) or the Pilot’s Operating Handbook (POH) to determine the amount of error that is introduced into the system when utilizing the alternate static source. In an aircraft not equipped with an alternate static source, an alternate method of introducing static pressure into the system should a blockage occur is to break the glass face of the VSI. This most likely renders the VSI inoperative. The reason for choosing the VSI as the instrument to break is that it is the least important static source instrument for flight.
Altimeters
The altimeter is an instrument that measures the height of an aircraft above a given pressure level. Pressure levels are discussed later in detail. Since the altimeter is the only instrument that is capable of indicating altitude, this is one of the most vital instruments installed in the aircraft. To use the altimeter effectively, the pilot must understand the operation of the instrument, as well as the errors associated with the altimeter and how each affect the indication.
A stack of sealed aneroid wafers comprise the main component of the altimeter. An aneroid wafer is a sealed wafer that is evacuated to an internal pressure of 29.92 inches of mercury (“Hg). These wafers are free to expand and contract with changes to the static pressure. A higher static pressure presses down on the wafers and causes them to collapse. A lower static pressure (less than 29.92 “Hg) allows the wafers to expand. A mechanical linkage connects the wafer movement to the needles on the indicator face, which translates compression of the wafers into a decrease in altitude and translates an expansion of the wafers into an increase in altitude. [Figure 1-2]
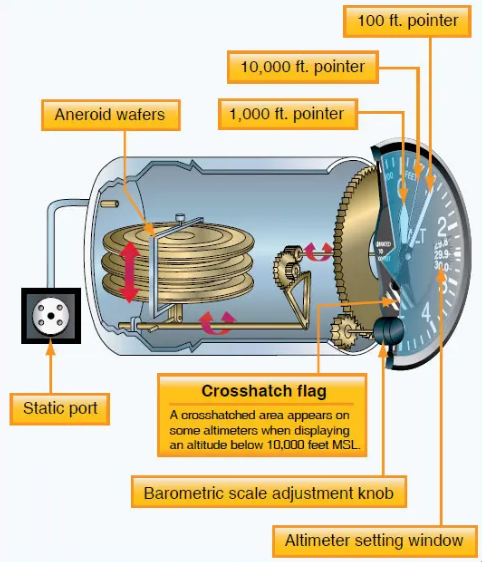
Notice how the static pressure is introduced into the rear of the sealed altimeter case. The altimeter’s outer chamber is sealed, which allows the static pressure to surround the aneroid wafers. If the static pressure is higher than the pressure in the aneroid wafers (29.92 “Hg), then the wafers are compressed until the pressure inside the wafers is equal to the surrounding static pressure. Conversely, if the static pressure is less than the pressure inside of the wafers, the wafers are able to expand which increases the volume. The expansion and contraction of the wafers moves the mechanical linkage which drives the needles on the face of the altimeter.
Principle of Operation
The pressure altimeter is an aneroid barometer that measures the pressure of the atmosphere at the level where the altimeter is located and presents an altitude indication in feet. The altimeter uses static pressure as its source of operation. Air is denser at sea level than aloft—as altitude increases, atmospheric pressure decreases. This difference in pressure at various levels causes the altimeter to indicate changes in altitude.
The presentation of altitude varies considerably between different types of altimeters. Some have one pointer while others have two or more. Only the multipointer type is discussed in this handbook. The dial of a typical altimeter is graduated with numerals arranged clockwise from zero to nine. Movement of the aneroid element is transmitted through gears to the three hands that indicate altitude. In Figure 8-2, the long, thin needle with the inverted triangle at the end indicates tens of thousands of feet; the short, wide needle indicates thousands of feet; and the long needle on top indicates hundreds of feet.
This indicated altitude is correct, however, only when the sea level barometric pressure is standard (29.92 “Hg), the sea level free air temperature is standard (+15 degrees Celsius (°C) or 59 degrees Fahrenheit (°F)), and the pressure and temperature decrease at a standard rate with an increase in altitude. Adjustments for nonstandard pressures are accomplished by setting the corrected pressure into a barometric scale located on the face of the altimeter. The barometric pressure window is sometimes referred to as the Kollsman window; only after the altimeter is set does it indicate the correct altitude. The word “correct” will need to be better explained when referring to types of altitudes, but is commonly used in this case to denote the approximate altitude above sea level. In other words, the indicated altitude refers to the altitude read off of the altitude which is uncorrected, after the barometric pressure setting is dialed into the Kollsman window. The additional types of altitudes are further explained later.
Effect of Nonstandard Pressure and Temperature
It is easy to maintain a consistent height above ground if the barometric pressure and temperature remain constant, but this is rarely the case. The pressure and temperature can change between takeoff and landing even on a local flight. If these changes are not taken into consideration, flight becomes dangerous.
If altimeters could not be adjusted for nonstandard pressure, a hazardous situation could occur. For example, if an aircraft is flown from a high pressure area to a low pressure area without adjusting the altimeter, a constant altitude will be displayed, but the actual height of the aircraft above the ground would be lower then the indicated altitude. There is an old aviation axiom: “GOING FROM A HIGH TO A LOW, LOOK OUT BELOW.” Conversely, if an aircraft is flown from a low pressure area to a high pressure area without an adjustment of the altimeter, the actual altitude of the aircraft is higher than the indicated altitude. Once in flight, it is important to frequently obtain current altimeter settings en route to ensure terrain and obstruction clearance.
Many altimeters do not have an accurate means of being adjusted for barometric pressures in excess of 31.00 “Hg. When the altimeter cannot be set to the higher pressure setting, the aircraft actual altitude is higher than the altimeter indicates. When low barometric pressure conditions occur (below 28.00), flight operations by aircraft unable to set the actual altimeter setting are not recommended.
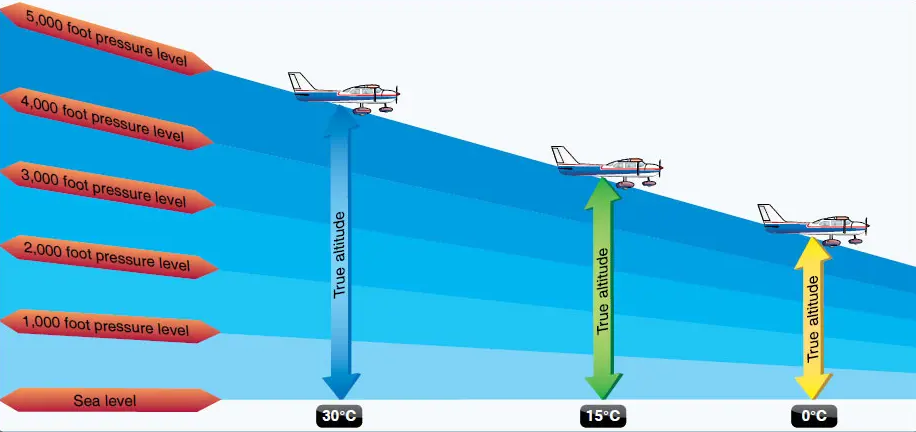
Adjustments to compensate for nonstandard pressure do not compensate for nonstandard temperature. Since cold air is denser than warm air, when operating in temperatures that are colder than standard, the altitude is lower than the altimeter indication. [Figure 1-3] It is the magnitude of this “difference” that determines the magnitude of the error. It is the difference due to colder temperatures that concerns the pilot. When flying into a cooler air mass while maintaining a constant indicated altitude, true altitude is lower. If terrain or obstacle clearance is a factor in selecting a cruising altitude, particularly in mountainous terrain, remember to anticipate that a colder-than-standard temperature places the aircraft lower than the altimeter indicates. Therefore, a higher indicated altitude may be required to provide adequate terrain clearance. A variation of the memory aid used for pressure can be employed: “FROM HOT TO COLD, LOOK OUT BELOW.” When the air is warmer than standard, the aircraft is higher than the altimeter indicates. Altitude corrections for temperature can be computed on the navigation computer.
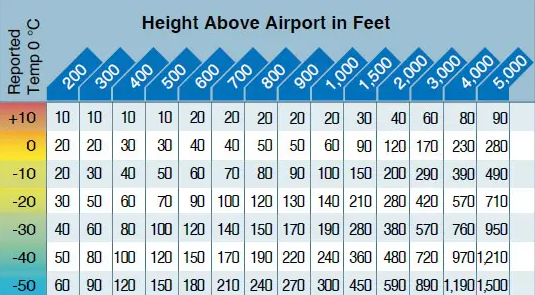
Figure 1-4.
Look at the chart using a temperature of –10 °C and an aircraft altitude of 1,000 feet above the airport elevation. The chart shows that the reported current altimeter setting may place the aircraft as much as 100 feet below the altitude indicated by the altimeter.
Extremely cold temperatures also affect altimeter indications. [Figure 1-4], which was derived from ICAO formulas, indicates how much error can exist when the temperature is extremely cold.
Setting the Altimeter
Most altimeters are equipped with a barometric pressure setting window (or Kollsman window) providing a means to adjust the altimeter. A knob is located at the bottom of the instrument for this adjustment.
To adjust the altimeter for variation in atmospheric pressure, the pressure scale in the altimeter setting window, calibrated in inches of mercury (“Hg) and/or millibars (mb), is adjusted to match the given altimeter setting. Altimeter setting is defined as station pressure reduced to sea level, but an altimeter setting is accurate only in the vicinity of the reporting station. Therefore, the altimeter must be adjusted as the flight progresses from one station to the next. Air traffic control (ATC) will advise when updated altimeter settings are available. If a pilot is not utilizing ATC assistance, local altimeter settings can be obtained by monitoring local automated weather observing system/automated surface observation system (AWOS/ASOS) or automatic terminal information service (ATIS) broadcasts.
Many pilots confidently expect the current altimeter setting will compensate for irregularities in atmospheric pressure at all altitudes, but this is not always true. The altimeter setting broadcast by ground stations is the station pressure corrected to mean sea level. It does not account for the irregularities at higher levels, particularly the effect of nonstandard temperature. If each pilot in a given area is using the same altimeter setting, each altimeter should be equally affected by temperature and pressure variation errors, making it possible to maintain the desired vertical separation between aircraft. This does not guarantee vertical separation though. It is still imperative to maintain a regimented visual scan for intruding air traffic.
When flying over high, mountainous terrain, certain atmospheric conditions cause the altimeter to indicate an altitude of 1,000 feet or more higher than the actual altitude. For this reason, a generous margin of altitude should be allowed—not only for possible altimeter error, but also for possible downdrafts that might be associated with high winds.
To illustrate the use of the altimeter setting system, follow a flight from Dallas Love Field, Texas, to Abilene Municipal Airport, Texas, via Mineral Wells. Before taking off from Love Field, the pilot receives a current altimeter setting of 29.85 “Hg from the control tower or ATIS and sets this value in the altimeter setting window. The altimeter indication should then be compared with the known airport elevation of 487 feet. Since most altimeters are not perfectly calibrated, an error may exist.
When over Mineral Wells, assume the pilot receives a current altimeter setting of 29.94 “Hg and sets this in the altimeter window. Before entering the traffic pattern at Abilene Municipal Airport, a new altimeter setting of 29.69 “Hg is received from the Abilene Control Tower and set in the altimeter setting window. If the pilot desires to fly the traffic pattern at approximately 800 feet above the terrain, and the field elevation of Abilene is 1,791 feet, an indicated altitude of 2,600 feet should be maintained (1,791 feet + 800 feet = 2,591 feet, rounded to 2,600 feet).
The importance of properly setting the altimeter cannot be overemphasized. Assume the pilot did not adjust the altimeter at Abilene to the current setting and continued using the Mineral Wells setting of 29.94 “Hg. When entering the Abilene traffic pattern at an indicated altitude of 2,600 feet, the aircraft would be approximately 250 feet below the proper traffic pattern altitude. Upon landing, the altimeter would indicate approximately 250 feet higher than the field elevation.
|
Mineral Wells altimeter setting |
29.94 |
|
Abilene altimeter setting |
29.69 |
|
Difference |
0.25 |
(Since 1 inch of pressure is equal to approximately 1,000 feet of altitude, 0.25 × 1,000 feet = 250 feet.)
When determining whether to add or subtract the amount of altimeter error, remember that when the actual pressure is lower than what is set in the altimeter window, the actual altitude of the aircraft is lower than what is indicated on the altimeter.
The following is another method of computing the altitude deviation. Start by subtracting the current altimeter setting from 29.94 “Hg. Always remember to place the original setting as the top number. Then subtract the current altimeter setting.
|
Mineral Wells altimeter setting |
29.94 |
|
Abilene altimeter setting |
29.69 |
|
29.94 – 29.69 = Difference |
0.25 |
(Since 1 inch of pressure is equal to approximately 1,000 feet of altitude, 0.25 × 1,000 feet = 250 feet.) Always subtract the number from the indicated altitude.
2,600 – 250 = 2,350
Now, try a lower pressure setting. Adjust from altimeter setting 29.94 to 30.56 “Hg.
|
Mineral Wells altimeter setting |
29.94 |
|
Altimeter setting |
30.56 |
|
29.94 – 30.56 = Difference |
–0.62 |
(Since 1 inch of pressure is equal to approximately 1,000 feet of altitude, 0.62 × 1,000 feet = 620 feet.) Always subtract the number from the indicated altitude.
2,600 – (–620) = 3,220
The pilot will be 620 feet high.
Notice the difference is a negative number. Starting with the current indicated altitude of 2,600 feet, subtracting a negative number is the same as adding the two numbers. By utilizing this method, a pilot will better understand the importance of using the current altimeter setting (miscalculation of where and in what direction an error lies can affect safety; if altitude is lower than indicated altitude, an aircraft could be in danger of colliding with an obstacle).
Altimeter Operation
There are two means by which the altimeter pointers can be moved. The first is a change in air pressure, while the other is an adjustment to the barometric scale. When the aircraft climbs or descends, changing pressure within the altimeter case expands or contracts the aneroid barometer. This movement is transmitted through mechanical linkage to rotate the pointers.
A decrease in pressure causes the altimeter to indicate an increase in altitude, and an increase in pressure causes the altimeter to indicate a decrease in altitude. Accordingly, if the aircraft is sitting on the ground with a pressure level of 29.98 “Hg and the pressure level changes to 29.68 “Hg, the altimeter would show an increase of approximately 300 feet in altitude. This pressure change is most noticeable when the aircraft is left parked over night. As the pressure falls, the altimeter interprets this as a climb. The altimeter indicates an altitude above the actual field elevation. If the barometric pressure setting is reset to the current altimeter setting of 29.68 “Hg, then the field elevation is again indicated on the altimeter.
This pressure change is not as easily noticed in flight since aircraft fly at specific altitudes. The aircraft steadily decreases true altitude while the altimeter is held constant through pilot action as discussed in the previous section.
Knowing the aircraft’s altitude is vitally important to a pilot. The pilot must be sure that the aircraft is flying high enough to clear the highest terrain or obstruction along the intended route. It is especially important to have accurate altitude information when visibility is restricted. To clear obstructions, the pilot must constantly be aware of the altitude of the aircraft and the elevation of the surrounding terrain. To reduce the possibility of a midair collision, it is essential to maintain altitude in accordance with air traffic rules.
Types of Altitude
Altitude in itself is a relevant term only when it is specifically stated to which type of altitude a pilot is referring. Normally when the term “altitude” is used, it is referring to altitude above sea level since this is the altitude which is used to depict obstacles and airspace, as well as to separate air traffic.
Altitude is vertical distance above some point or level used as a reference. There are as many kinds of altitude as there are reference levels from which altitude is measured, and each may be used for specific reasons. Pilots are mainly concerned with five types of altitudes:
-
Indicated altitude—read directly from the altimeter (uncorrected) when it is set to the current altimeter setting.
-
True altitude—the vertical distance of the aircraft above sea level—the actual altitude. It is often expressed as feet above mean sea level (MSL). Airport, terrain, and obstacle elevations on aeronautical charts are true altitudes.
-
Absolute altitude—the vertical distance of an aircraft above the terrain, or above ground level (AGL).
-
Pressure altitude—the altitude indicated when the altimeter setting window (barometric scale) is adjusted to 29.92 “Hg. This is the altitude above the standard datum plane, which is a theoretical plane where air pressure (corrected to 15 °C) equals 29.92 “Hg. Pressure altitude is used to compute density altitude, true altitude, true airspeed (TAS), and other performance data.
-
Density altitude—pressure altitude corrected for variations from standard temperature. When conditions are standard, pressure altitude and density altitude are the same. If the temperature is above standard, the density altitude is higher than pressure altitude. If the temperature is below standard, the density altitude is lower than pressure altitude. This is an important altitude because it is directly related to the aircraft’s performance.
A pilot must understand how the performance of the aircraft is directly related to the density of the air. The density of the air affects how much power a naturally aspirated engine produces, as well as how efficient the airfoils are. If there are fewer air molecules (lower pressure) to accelerate through the propeller, the acceleration to rotation speed is longer and thus produces a longer takeoff roll, which translates to a decrease in performance.
As an example, consider an airport with a field elevation of 5,048 feet MSL where the standard temperature is 5 °C. Under these conditions, pressure altitude and density altitude are the same—5,048 feet. If the temperature changes to 30 °C, the density altitude increases to 7,855 feet. This means an aircraft would perform on takeoff as though the field elevation were 7,855 feet at standard temperature. Conversely, a temperature of –25 °C would result in a density altitude of 1,232 feet. An aircraft would perform much better under these conditions.
Instrument Check
Prior to each flight, a pilot should examine the altimeter for proper indications in order to verify its validity. To determine the condition of an altimeter, set the barometric scale to the current reported altimeter setting transmitted by the local airport traffic control tower, flight service station (FSS), or any other reliable source, such as ATIS, AWOS, or ASOS. The altimeter pointers should indicate the surveyed field elevation of the airport. If the indication is off more than 75 feet from the surveyed field elevation, the instrument should be referred to a certificated instrument repair station for recalibration.
Vertical Speed Indicator (VSI)
The VSI, which is sometimes called a vertical velocity indicator (VVI), indicates whether the aircraft is climbing, descending, or in level flight. The rate of climb or descent is indicated in feet per minute (fpm). If properly calibrated, the VSI indicates zero in level flight. [Figure 1-5]
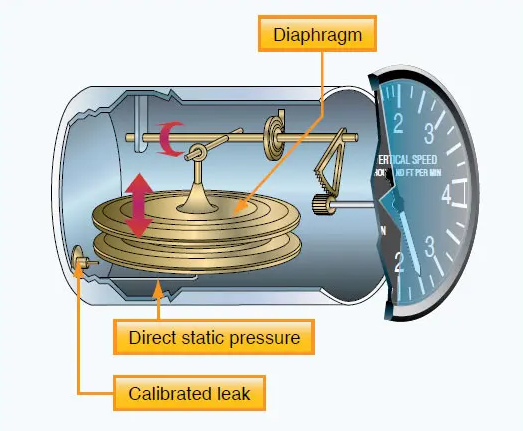
Principle of Operation
Although the VSI operates solely from static pressure, it is a differential pressure instrument. It contains a diaphragm with connecting linkage and gearing to the indicator pointer inside an airtight case. The inside of the diaphragm is connected directly to the static line of the pitot-static system. The area outside the diaphragm, which is inside the instrument case, is also connected to the static line but through a restricted orifice (calibrated leak).
Both the diaphragm and the case receive air from the static line at existing atmospheric pressure. The diaphragm receives unrestricted air, while the case receives the static pressure via the metered leak. When the aircraft is on the ground or in level flight, the pressures inside the diaphragm and the instrument case are equal, and the pointer is at the zero indication. When the aircraft climbs or descends, the pressure inside the diaphragm changes immediately, but due to the metering action of the restricted passage, the case pressure remains higher or lower for a short time, causing the diaphragm to contract or expand. This causes a pressure differential that is indicated on the instrument needle as a climb or descent. When the pressure differential stabilizes at a definite ratio, the needle indicates the rate of altitude change.
The VSI displays two different types of information:
-
Trend information shows an immediate indication of an increase or decrease in the aircraft’s rate of climb or descent.
-
Rate information shows a stabilized rate of change in altitude.
The trend information is the direction of movement of the VSI needle. For example, if an aircraft is maintaining level flight and the pilot pulls back on the control yoke causing the nose of the aircraft to pitch up, the VSI needle moves upward to indicate a climb. If the pitch attitude is held constant, the needle stabilizes after a short period (6–9 seconds) and indicates the rate of climb in hundreds of fpm. The time period from the initial change in the rate of climb, until the VSI displays an accurate indication of the new rate, is called the lag. Rough control technique and turbulence can extend the lag period and cause erratic and unstable rate indications. Some aircraft are equipped with an instantaneous vertical speed indicator (IVSI), which incorporates accelerometers to compensate for the lag in the typical VSI. [Figure 1-6]
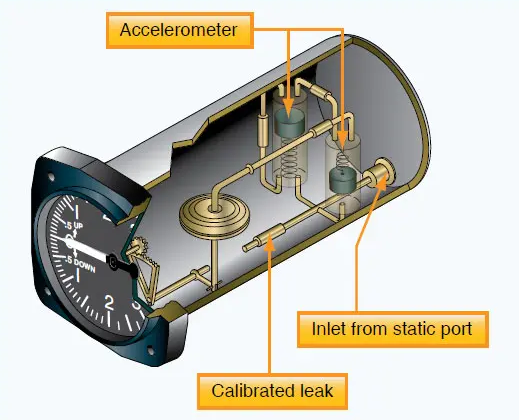
Figure 1-6. An IVSI incorporates accelerometers to help the instrument immediately indicate changes in vertical speed.
Instrument Check
As part of a preflight check, proper operation of the VSI must be established. Make sure the VSI indicates a near zero reading prior to leaving the ramp area and again just before takeoff. If the VSI indicates anything other than zero, that indication can be referenced as the zero mark. Normally, if the needle is not exactly zero, it is only slightly above or below the zero line. After takeoff, the VSI should trend upward to indicate a positive rate of climb and then, once a stabilized climb is established, a rate of climb can be referenced.
Air Speed Indicator (ASI)
The ASI is a sensitive, differential pressure gauge that measures and promptly indicates the difference between pitot (impact/dynamic pressure) and static pressure. These two pressures are equal when the aircraft is parked on the ground in calm air. When the aircraft moves through the air, the pressure on the pitot line becomes greater than the pressure in the static lines. This difference in pressure is registered by the airspeed pointer on the face of the instrument, which is calibrated in miles per hour, knots (nautical miles per hour), or both. [Figure 1-7]
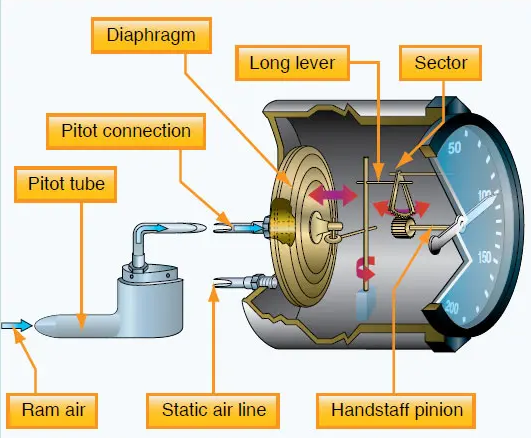
Figure 1-7. Air Speed Indicator (ASI).
The ASI is the one instrument that utilizes both the pitot, as well as the static system. The ASI introduces the static pressure into the airspeed case while the pitot pressure (dynamic) is introduced into the diaphragm. The dynamic pressure expands or contracts one side of the diaphragm, which is attached to an indicating system. The system drives the mechanical linkage and the airspeed needle.
Just as in altitudes, there are multiple types of airspeeds. Pilots need to be very familiar with each type.
-
Indicated airspeed (IAS)—the direct instrument reading obtained from the ASI, uncorrected for variations in atmospheric density, installation error, or instrument error. Manufacturers use this airspeed as the basis for determining aircraft performance. Takeoff, landing, and stall speeds listed in the AFM/ POH are IAS and do not normally vary with altitude or temperature.
-
Calibrated airspeed (CAS)—IAS corrected for installation error and instrument error. Although manufacturers attempt to keep airspeed errors to a minimum, it is not possible to eliminate all errors throughout the airspeed operating range. At certain airspeeds and with certain flap settings, the installation and instrument errors may total several knots. This error is generally greatest at low airspeeds. In the cruising and higher airspeed ranges, IAS and CAS are approximately the same. Refer to the airspeed calibration chart to correct for possible airspeed errors.
-
True airspeed (TAS)—CAS corrected for altitude and nonstandard temperature. Because air density decreases with an increase in altitude, an aircraft has to be flown faster at higher altitudes to cause the same pressure difference between pitot impact pressure and static pressure. Therefore, for a given CAS, TAS increases as altitude increases; or for a given TAS, CAS decreases as altitude increases. A pilot can find TAS by two methods. The most accurate method is to use a flight computer. With this method, the CAS is corrected for temperature and pressure variation by using the airspeed correction scale on the computer. Extremely accurate electronic flight computers are also available. Just enter the CAS, pressure altitude, and temperature, and the computer calculates the TAS. A second method, which is a rule of thumb, provides the approximate TAS. Simply add 2 percent to the CAS for each 1,000 feet of altitude. The TAS is the speed that is used for flight planning and is used when filing a flight plan.
-
Groundspeed (GS)—the actual speed of the airplane over the ground. It is TAS adjusted for wind. GS decreases with a headwind and increases with a tailwind.
Airspeed Indicator Markings
Aircraft weighing 12,500 pounds or less, manufactured after 1945, and certificated by the FAA are required to have ASIs marked in accordance with a standard color-coded marking system. This system of color-coded markings enables a pilot to determine at a glance certain airspeed limitations that are important to the safe operation of the aircraft. For example, if during the execution of a maneuver, it is noted that the airspeed needle is in the yellow arc and rapidly approaching the red line, the immediate reaction should be to reduce airspeed.
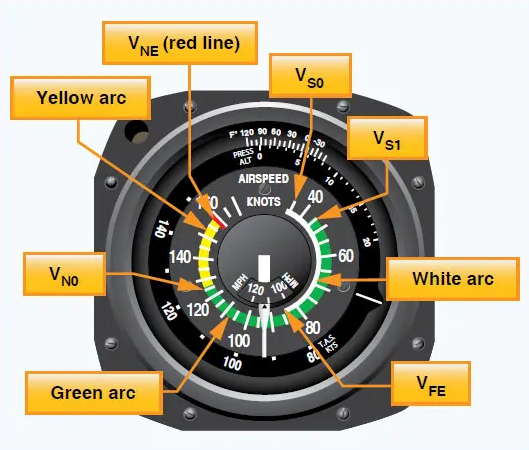
Figure 1-8. Single Engine Air Speed Indicator (ASI).
As shown in Figure 1-8, ASIs on single-engine small aircraft include the following standard color-coded markings:
-
White arc—commonly referred to as the flap operating range since its lower limit represents the full flap stall speed and its upper limit provides the maximum flap speed. Approaches and landings are usually flown at speeds within the white arc.
-
Lower limit of white arc (VS0)—the stalling speed or the minimum steady flight speed in the landing configuration. In small aircraft, this is the power-off stall speed at the maximum landing weight in the landing configuration (gear and flaps down).
-
Upper limit of the white arc (VFE)—the maximum speed with the flaps extended.
-
Green arc—the normal operating range of the aircraft. Most flying occurs within this range.
-
Lower limit of green arc (VS1)—the stalling speed or the minimum steady flight speed obtained in a specified configuration. For most aircraft, this is the power-off stall speed at the maximum takeoff weight in the clean configuration (gear up, if retractable, and flaps up).
-
Upper limit of green arc (VN0)—the maximum structural cruising speed. Do not exceed this speed except in smooth air.
-
Yellow arc—caution range. Fly within this range only in smooth air and then only with caution.
-
Red line (VNE)—never exceed speed. Operating above this speed is prohibited since it may result in damage or structural failure.
Other Airspeed Limitations
Some important airspeed limitations are not marked on the face of the ASI, but are found on placards and in the AFM/ POH. These airspeeds include:
-
Design maneuvering speed (VA)—the maximum speed at which the structural design’s limit load can be imposed (either by gusts or full deflection of the control surfaces) without causing structural damage. It is important to consider weight when referencing this speed. For example, VA may be 100 knots when an airplane is heavily loaded, but only 90 knots when the load is light.
-
Landing gear operating speed (VLO)—the maximum speed for extending or retracting the landing gear if flying an aircraft with retractable landing gear.
-
Landing gear extended speed (VLE)—the maximum speed at which an aircraft can be safely flown with the landing gear extended.
-
Best angle-of-climb speed (VX)—the airspeed at which an aircraft gains the greatest amount of altitude in a given distance. It is used during a short-field takeoff to clear an obstacle.
-
Best rate-of-climb speed (VY)—the airspeed that provides the most altitude gain in a given period of time.
-
Single-engine best rate-of-climb (VYSE)—the best rate-of-climb or minimum rate-of-sink in a light twin-engine aircraft with one engine inoperative. It is marked on the ASI with a blue line. VYSE is commonly referred to as “Blue Line.”
-
Minimum control speed (VMC)—the minimum flight speed at which a light, twin-engine aircraft can be satisfactorily controlled when an engine suddenly becomes inoperative and the remaining engine is at takeoff power.
Instrument Check
Prior to takeoff, the ASI should read zero. However, if there is a strong wind blowing directly into the pitot tube, the ASI may read higher than zero. When beginning the takeoff, make sure the airspeed is increasing at an appropriate rate.
Errors
almost always indicate blockage of the pitot tube, the static
port(s), or both. Blockage may be caused by moisture (including ice),
dirt, or even insects. During preflight, make sure the pitot tube
cover is removed. Then, check the pitot and static port openings. A
blocked pitot tube affects the accuracy of the ASI, but a blockage of
the static port not only affects the ASI, but also causes errors in
the altimeter and VSI.Blockage of the Pitot Static System
Blocked Pitot System
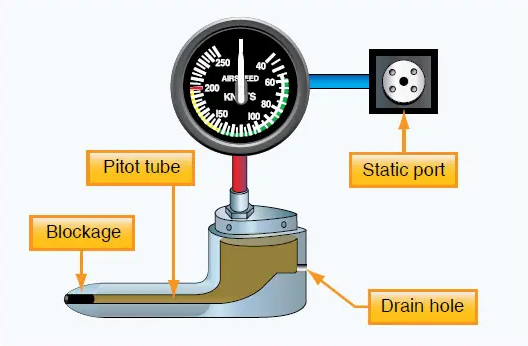
The pitot system can become blocked completely or only partially if the pitot tube drain hole remains open. If the pitot tube becomes blocked and its associated drain hole remains clear, ram air is no longer able to enter the pitot system. Air already in the system vents through the drain hole, and the remaining pressure drops to ambient (outside) air pressure. Under these circumstances, the ASI reading decreases to zero because the ASI senses no difference between ram and static air pressure. The ASI no longer operates since dynamic pressure cannot enter the pitot tube opening. Static pressure is able to equalize on both sides since the pitot drain hole is still open. The apparent loss of airspeed is not usually instantaneous but happens very quickly. [Figure 1-9]
If both the pitot tube opening and the drain hole should become clogged simultaneously, then the pressure in the pitot tube is trapped. No change is noted on the airspeed indication should the airspeed increase or decrease. If the static port is unblocked and the aircraft should change altitude, then a change is noted on the ASI. The change is not related to a change in airspeed but a change in static pressure. The total pressure in the pitot tube does not change due to the blockage; however, the static pressure will change.
Because airspeed indications rely upon both static and dynamic pressure together, the blockage of either of these systems affects the ASI reading. Remember that the ASI has a diaphragm in which dynamic air pressure is entered. Behind this diaphragm is a reference pressure called static pressure that comes from the static ports. The diaphragm pressurizes against this static pressure and as a result changes the airspeed indication via levers and indicators. [Figure 1-10]
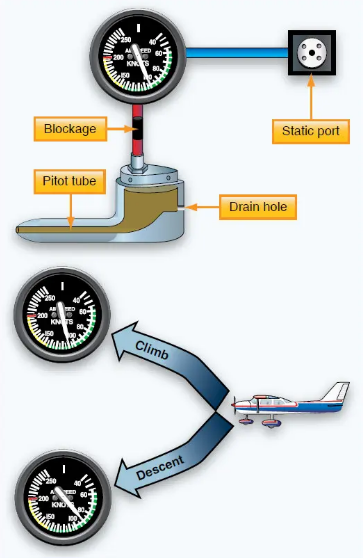
Figure 1-10. A blocked pitot tube, but clear drain hole.
For example, take an aircraft and slow it down to zero knots at a given altitude. If the static port (providing static pressure) and the pitot tube (providing dynamic pressure) are both unobstructed, the following claims can be made:
-
The ASI would be zero.
-
Dynamic pressure and static pressure are equal.
-
Because both dynamic and static air pressure are equal at zero speed with increased speed, dynamic pressure must include two components: static pressure and dynamic pressure.
It can be inferred that airspeed indication must be based upon a relationship between these two pressures, and indeed it is. An ASI uses the static pressure as a reference pressure and as a result, the ASI’s case is kept at this pressure behind the diaphragm. On the other hand, the dynamic pressure through the pitot tube is connected to a highly sensitive diaphragm within the ASI case. Because an aircraft in zero motion (regardless of altitude) results in a zero airspeed, the pitot tube always provides static pressure in addition to dynamic pressure.
Therefore, the airspeed indication is the result of two pressures: the pitot tube static and dynamic pressure within the diaphragm as measured against the static pressure in the ASI’s case.
If the aircraft were to descend while the pitot tube is obstructed, the pressure in the pitot system, including the diaphragm, would remain constant. But as the descent is made, the static pressure would increase against the diaphragm causing it to compress, thereby resulting in an indication of decreased airspeed. Conversely, if the aircraft were to climb, the static pressure would decrease allowing the diaphragm to expand, thereby showing an indication of greater airspeed. [Figure 8-10]
The pitot tube may become blocked during flight due to visible moisture. Some aircraft may be equipped with pitot heat for flight in visible moisture. Consult the AFM/POH for specific procedures regarding the use of pitot heat.
Blocked Static System
If the static system becomes blocked but the pitot tube remains clear, the ASI continues to operate; however, it is inaccurate. The airspeed indicates lower than the actual airspeed when the aircraft is operated above the altitude where the static ports became blocked because the trapped static pressure is higher than normal for that altitude. When operating at a lower altitude, a faster than actual airspeed is displayed due to the relatively low static pressure trapped in the system.
Revisiting the ratios that were used to explain a blocked pitot tube, the same principle applies for a blocked static port. If the aircraft descends, the static pressure increases on the pitot side showing an increase on the ASI. This assumes that the aircraft does not actually increase its speed. The increase in static pressure on the pitot side is equivalent to an increase in dynamic pressure since the pressure cannot change on the static side.
If an aircraft begins to climb after a static port becomes blocked, the airspeed begins to show a decrease as the aircraft continues to climb. This is due to the decrease in static pressure on the pitot side, while the pressure on the static side is held constant.
A blockage of the static system also affects the altimeter and VSI. Trapped static pressure causes the altimeter to freeze at the altitude where the blockage occurred. In the case of the VSI, a blocked static system produces a continuous zero indication. [Figure 1-11]
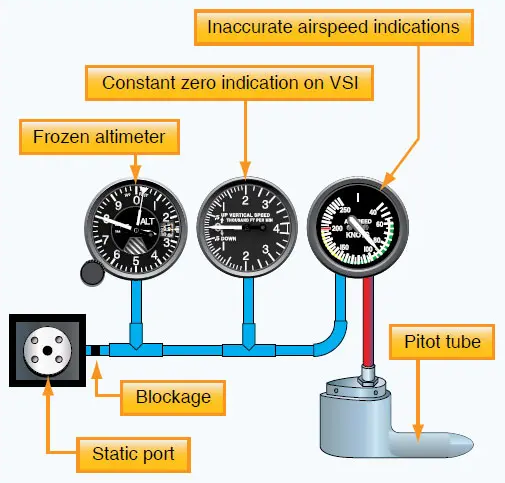
Figure 1-11. Blocked static system.
Some aircraft are equipped with an alternate static source in the flight deck. In the case of a blocked static source, opening the alternate static source introduces static pressure from the flight deck into the system. Flight deck static pressure is lower than outside static pressure. Check the aircraft AOM/POH for airspeed corrections when utilizing alternate static pressure.
Electronic Flight Display (EFD)
Advances in technology have brought about changes in the instrumentation found in all types of aircraft; for example, Electronic Flight Displays (EFDs) commonly referred to as “glass cockpits.” EFDs include flight displays such as primary flight displays (PFD) and multi-function displays (MFD). This has changed not only what information is available to a pilot, but also how the information is displayed. In addition to the improvement in system reliability, which increases overall safety, EFDs have decreased the overall cost of equipping aircraft with state-of-the-art instrumentation. Primary electronic instrumentation packages are less prone to failure than their analogue counterparts. No longer is it necessary for aircraft designers to create cluttered panel layouts in order to accommodate all necessary flight instruments. Instead, multi-panel digital flight displays combine all flight instruments onto a single screen that is called a primary flight display (PFD). The traditional “six pack” of instruments is now displayed on one liquid crystal display (LCD) screen.
Airspeed Tape
Configured similarly to traditional panel layouts, the ASI is located on the left side of the screen and is displayed as a vertical speed tape. As the aircraft increases in speed, the larger numbers descend from the top of the tape. The TAS is displayed at the bottom of the tape through the input to the air data computer (ADC) from the outside air temperature probe. Airspeed markings for VX, VY, and rotation speed (VR) are displayed for pilot reference. An additional pilot-controlled airspeed bug is available to set at any desired reference speed. As on traditional analogue ASIs, the electronic airspeed tape displays the color-coded ranges for the flap operating range, normal range, and caution range. [Figure 8-12] The number value changes color to red when the airspeed exceeds VNE to warn the pilot of exceeding the maximum speed limitation.
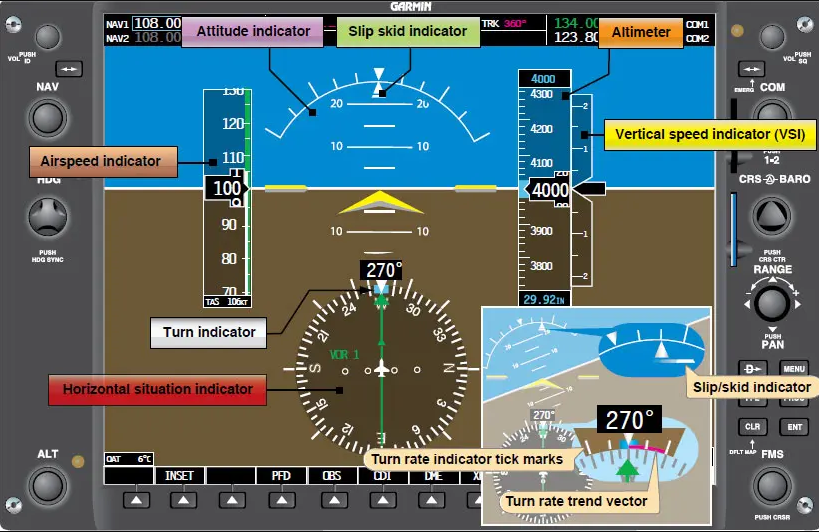
Attitude Indicator
One improvement over analogue instrumentation is the larger attitude indicator on EFD. The artificial horizon spans the entire width of the PFD. [Figure 1-12] This expanded instrumentation offers better reference through all phases of flight and all flight maneuvers. The attitude indicator receives its information from the Attitude Heading and Reference System (AHRS).
Altimeter
The altimeter is located on the right side of the PFD. [Figure 1-12] As the altitude increases, the larger numbers descend from the top of the display tape, with the current altitude being displayed in the black box in the center of the display tape. The altitude is displayed in increments of 20 feet.
Vertical Speed Indicator (VSI)
The VSI is displayed to the right of the altimeter tape and can take the form of an arced indicator or a vertical speed tape. [Figure 1-12] Both are equipped with a vertical speed bug.
Heading Indicator
The heading indicator is located below the artificial horizon and is normally modeled after a Horizontal Situation Indicator (HSI). [Figure 1-12] As in the case of the attitude indicator, the heading indicator receives its information from the magnetometer, which feeds information to the AHRS unit and then out to the PFD.
Turn Indicator
The turn indicator takes a slightly different form than the traditional instrumentation. A sliding bar moves left and right below the triangle to indicate deflection from coordinated flight. [Figure 1-12] Reference for coordinated flight comes from accelerometers contained in the AHRS unit.
Tachometer
The sixth instrument normally associated with the “six pack” package is the tachometer. This is the only instrument that is not located on the PFD. The tachometer is normally located on the multi-function display (MFD). In the event of a display screen failure, it is displayed on the remaining screen with the PFD flight instrumentation. [Figure 1-13]
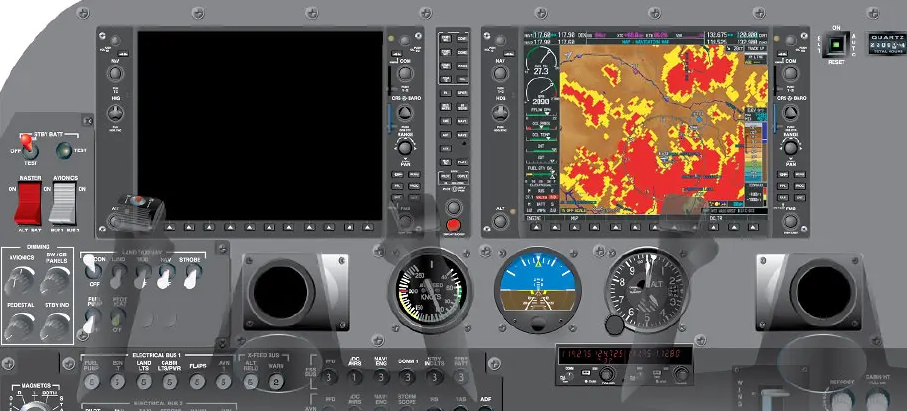
Figure 1-13. Multi-function display (MFD).
Slip/Skid Indicator
The slip/skid indicator is the horizontal line below the roll pointer. [Figure 1-12] Like a ball in a turn-and-slip indicator, a bar width off center is equal to one ball width displacement.
Turn Rate Indicator
The turn rate indicator, illustrated in Figure 1-12, is typically found directly above the rotating compass card. Tick marks to the left and right of the lubber line denote the turn (standard-rate versus half standard-rate). Typically denoted by a trend line, if the trend vector is extended to the second tick mark the aircraft is in a standard-rate turn.
Individual panel displays can be configured for a variety of aircraft by installing different software packages. [Figure 1-14] Manufacturers are also able to upgrade existing instrument displays in a similar manner, eliminating the need to replace individual gauges in order to upgrade.
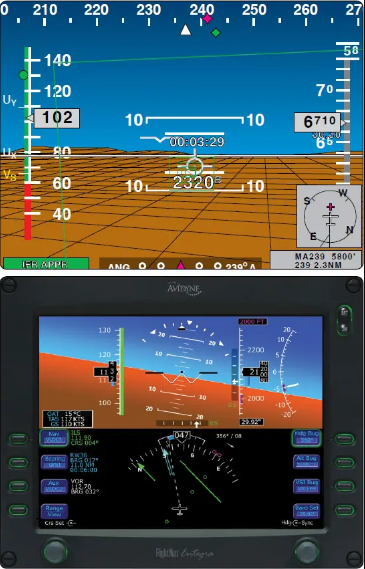
Figure 1-14. Chelton’s FlightLogic (top) and Avidyne’s Entegra (bottom) are examples of panel displays that are configurable.
Air Data Computer (ADC)
EFDs utilize the same type of instrument inputs as traditional analogue gauges; however, the processing system is different. The pitot static inputs are received by an ADC. The ADC computes the difference between the total pressure and the static pressure and generates the information necessary to display the airspeed on the PFD. Outside air temperatures are also monitored and introduced into various components within the system, as well as being displayed on the PFD screen. [Figure 1-15]
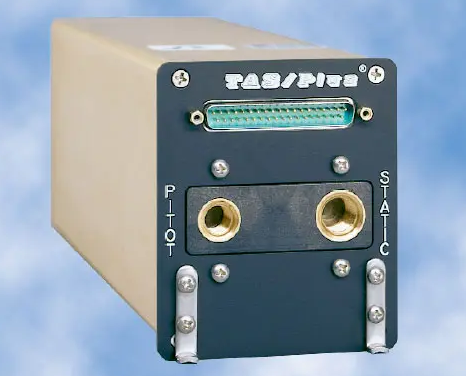
Figure 1-15. Teledyne’s 90004 TAS/Plus Air Data Computer (ADC) computes air data information from the pitot-static pneumatic system, aircraft temperature probe, and barometric correction device to help create a clear picture of flight characteristics.
The ADC is a separate solid state device that, in addition to providing data to the PFD, is capable of providing data to the autopilot control system. In the event of system malfunction, the ADC can quickly be removed and replaced in order to decrease downtime and decrease maintenance turn-around times.
Altitude information is derived from the static pressure port just as an analogue system does; however, the static pressure does not enter a diaphragm. The ADC computes the received barometric pressure and sends a digital signal to the PFD to display the proper altitude readout. EFDs also show trend vectors, which show the pilot how the altitude and airspeed are progressing.
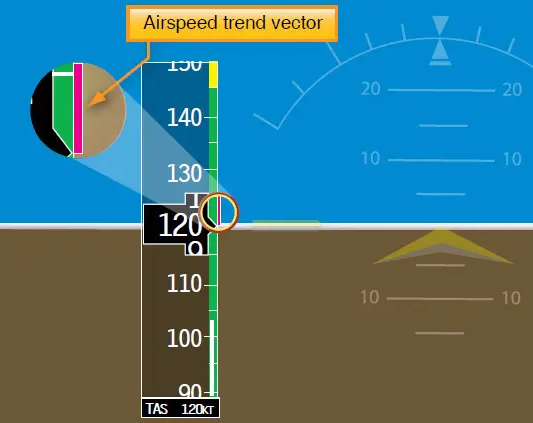
Figure 1-16. Airspeed trend vector.
Trend Vectors
Trend vectors are magenta lines that move up and down both the ASI and the altimeter. [Figures 1-16 and 1-17] The ADC computes the rate of change and displays the 6-second projection of where the aircraft will be. Pilots can utilize the trend vectors to better control the aircraft’s attitude. By including the trend vectors in the instrument scan, pilots are able to precisely control airspeed and altitude. Additional information can be obtained by referencing the Instrument Flying Handbook or specific avionics manufacturer’s training material.
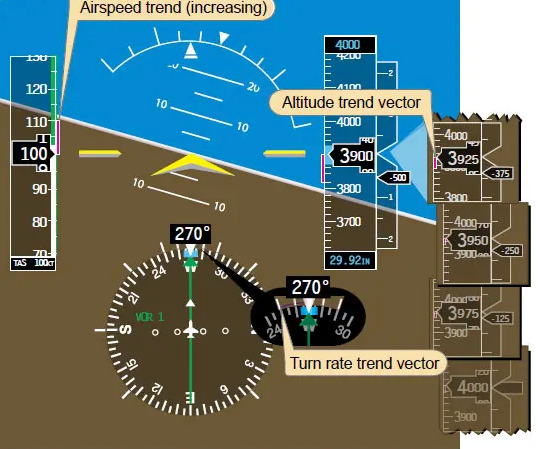
Figure 1-17. Altimeter trend vector.
Gyroscopic Flight Instruments
Several flight instruments utilize the properties of a gyroscope for their operation. The most common instruments containing gyroscopes are the turn coordinator, heading indicator, and the attitude indicator. To understand how these instruments operate requires knowledge of the instrument power systems, gyroscopic principles, and the operating principles of each instrument.
Gyroscopic principles
Any spinning object exhibits gyroscopic properties. A wheel or rotor designed and mounted to utilize these properties is called a gyroscope. Two important design characteristics of an instrument gyro are great weight for its size, or high density, and rotation at high speed with low friction bearings.
There are two general types of mountings; the type used depends upon which property of the gyro is utilized. A freely or universally mounted gyroscope is free to rotate in any direction about its center of gravity. Such a wheel is said to have three planes of freedom. The wheel or rotor is free to rotate in any plane in relation to the base and is balanced so that, with the gyro wheel at rest, it remains in the position in which it is placed. Restricted or semi-rigidly mounted gyroscopes are those mounted so that one of the planes of freedom is held fixed in relation to the base.
There are two fundamental properties of gyroscopic action: Rigidity in space and Precession.
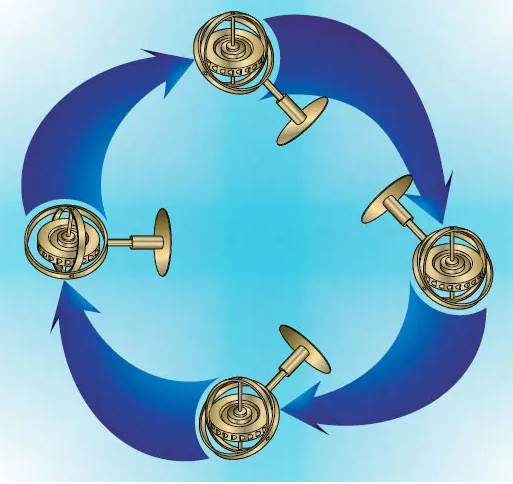
Rigidity in Space
Rigidity in space refers to the principle that a gyroscope remains in a fixed position in the plane in which it is spinning. An example of rigidity in space is that of a bicycle wheel. As the bicycle wheels increase speed, they become more stable in their plane of rotation. This is why a bicycle is unstable and maneuverable at low speeds and stable and less maneuverable at higher speeds.
By mounting this wheel, or gyroscope, on a set of gimbal rings, the gyro is able to rotate freely in any direction. Thus, if the gimbal rings are tilted, twisted, or otherwise moved, the gyro remains in the plane in which it was originally spinning. [Figure 1-18]
Precession
Precession is the tilting or turning of a gyro in response to a deflective force. The reaction to this force does not occur at the point at which it was applied; rather, it occurs at a point that is 90° later in the direction of rotation. This principle allows the gyro to determine a rate of turn by sensing the amount of pressure created by a change in direction. The rate at which the gyro precesses is inversely proportional to the speed of the rotor and proportional to the deflective force.
Using the example of the bicycle, precession acts on the wheels in order to allow the bicycle to turn. While riding at normal speed, it is not necessary to turn the handle bars in the direction of the desired turn. A rider simply leans in the direction that he or she wishes to go. Since the wheels are rotating in a clockwise direction when viewed from the right side of the bicycle, if a rider leans to the left, a force is applied to the top of the wheel to the left. The force actually acts 90° in the direction of rotation, which has the effect of applying a force to the front of the tire, causing the bicycle to move to the left. There is a need to turn the handlebars at low speeds because of the instability of the slowly turning gyros and also to increase the rate of turn.
Precession can also create some minor errors in some instruments. [Figure 1-19] Precession can cause a freely spinning gyro to become displaced from its intended plane of rotation through bearing friction, etc. Certain instruments may require corrective realignment during flight, such as the heading indicator.
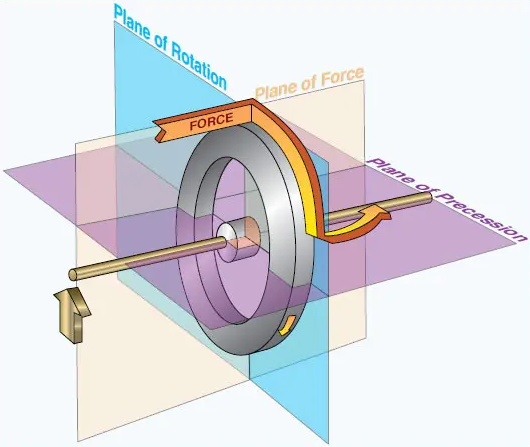
Figure 1-19. Precession of a gyroscope resulting from an applied deflective force.
Sources of Power
In some aircraft, all the gyros are vacuum, pressure, or electrically operated. In other aircraft, vacuum or pressure systems provide the power for the heading and attitude indicators, while the electrical system provides the power for the turn coordinator. Most aircraft have at least two sources of power to ensure at least one source of bank information is available if one power source fails. The vacuum or pressure system spins the gyro by drawing a stream of air against the rotor vanes to spin the rotor at high speed, much like the operation of a waterwheel or turbine. The amount of vacuum or pressure required for instrument operation varies, but is usually between 4.5 “Hg and 5.5 “Hg.
One source of vacuum for the gyros is a vane-type enginedriven pump that is mounted on the accessory case of the engine. Pump capacity varies in different aircraft, depending on the number of gyros.
A typical vacuum system consists of an engine-driven vacuum pump, relief valve, air filter, gauge, and tubing necessary to complete the connections. The gauge is mounted in the aircraft’s instrument panel and indicates the amount of pressure in the system (vacuum is measured in inches of mercury less than ambient pressure).
As shown in Figure 1-20, air is drawn into the vacuum system by the engine-driven vacuum pump. It first goes through a filter, which prevents foreign matter from entering the vacuum or pressure system. The air then moves through the attitude and heading indicators where it causes the gyros to spin. A relief valve prevents the vacuum pressure, or suction, from exceeding prescribed limits. After that, the air is expelled overboard or used in other systems, such as for inflating pneumatic deicing boots.
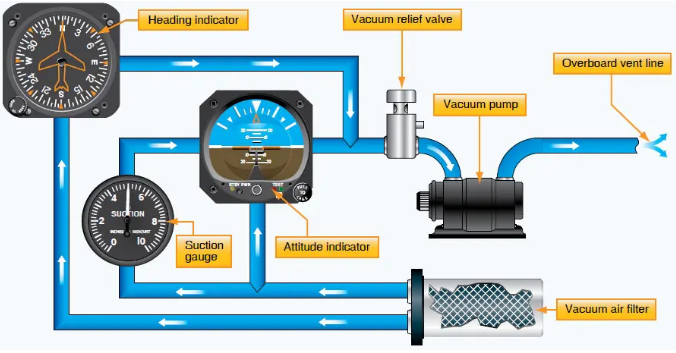
Figure 1-20. Typical vacuum system.
It is important to monitor vacuum pressure during flight, because the attitude and heading indicators may not provide reliable information when suction pressure is low. The vacuum, or suction, gauge is generally marked to indicate the normal range. Some aircraft are equipped with a warning light that illuminates when the vacuum pressure drops below the acceptable level.
When the vacuum pressure drops below the normal operating range, the gyroscopic instruments may become unstable and inaccurate. Cross-checking the instruments routinely is a good habit to develop.
Tutn Indicators
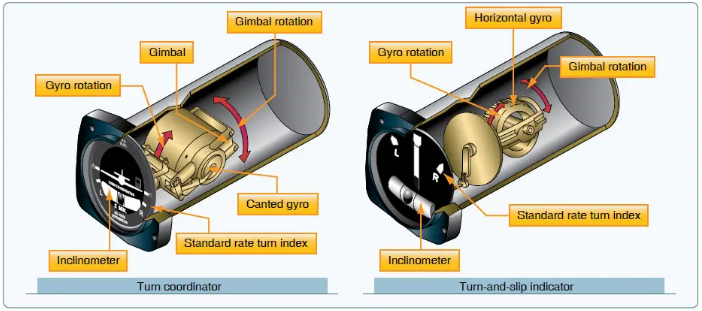
Aircraft use two types of turn indicators: turn-and-slip indicators and turn coordinators. Because of the way the gyro is mounted, the turn-and-slip indicator shows only the rate of turn in degrees per second. The turn coordinator is mounted at an angle, or canted, so it can initially show roll rate. When the roll stabilizes, it indicates rate of turn. Both instruments indicate turn direction and quality (coordination), and also serve as a backup source of bank information in the event an attitude indicator fails. Coordination is achieved by referring to the inclinometer, which consists of a liquid-filled curved tube with a ball inside. [Figure 1-21]
Turn-and-Slip Indicator
The gyro in the turn-and-slip indicator rotates in the vertical plane corresponding to the aircraft’s longitudinal axis. A single gimbal limits the planes in which the gyro can tilt, and a spring works to maintain a center position. Because of precession, a yawing force causes the gyro to tilt left or right, as viewed from the pilot seat. The turn-and-slip indicator uses a pointer, called the turn needle, to show the direction and rate of turn. The turn-and-slip indicator is incapable of “tumbling” off its rotational axis because of the restraining springs. When extreme forces are applied to a gyro, the gyro is displaced from its normal plane of rotation, rendering its indications invalid. Certain instruments have specific pitch and bank limits that induce a tumble of the gyro.
Turn Coordinator
The gimbal in the turn coordinator is canted; therefore, its gyro can sense both rate of roll and rate of turn. Since turn coordinators are more prevalent in training aircraft, this discussion concentrates on that instrument. When rolling into or out of a turn, the miniature aircraft banks in the direction the aircraft is rolled. A rapid roll rate causes the miniature aircraft to bank more steeply than a slow roll rate.
The turn coordinator can be used to establish and maintain a standard-rate turn by aligning the wing of the miniature aircraft with the turn index. Figure 8-22 shows a picture of a turn coordinator. There are two marks on each side (left and right) of the face of the instrument. The first mark is used to reference a wings level zero rate of turn. The second mark on the left and right side of the instrument serve to indicate a standard rate of turn. A standard-rate turn is defined as a turn rate of 3° per second. The turn coordinator indicates only the rate and direction of turn; it does not display a specific angle of bank.
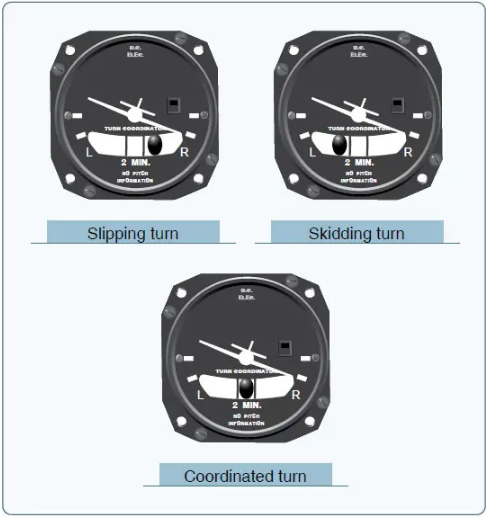
Figure 1-22. If inadequate right rudder is applied in a right turn, a slip results. Too much right rudder causes the aircraft to skid through the turn. Centering the ball results in a coordinated turn.
Inclinometer
The inclinometer is used to depict aircraft yaw, which is the side-to-side movement of the aircraft’s nose. During coordinated, straight-and-level flight, the force of gravity causes the ball to rest in the lowest part of the tube, centered between the reference lines. Coordinated flight is maintained by keeping the ball centered. If the ball is not centered, it can be centered by using the rudder.
To center the ball, apply rudder pressure on the side to which the ball is deflected. Use the simple rule, “step on the ball,” to remember which rudder pedal to press. If aileron and rudder are coordinated during a turn, the ball remains centered in the tube. If aerodynamic forces are unbalanced, the ball moves away from the center of the tube. As shown in Figure 8-22, in a slip, the rate of turn is too slow for the angle of bank, and the ball moves to the inside of the turn. In a skid, the rate of turn is too great for the angle of bank, and the ball moves to the outside of the turn. To correct for these conditions, and improve the quality of the turn, remember to “step on the ball.” Varying the angle of bank can also help restore coordinated flight from a slip or skid. To correct for a slip, decrease bank and/or increase the rate of turn. To correct for a skid, increase the bank and/or decrease the rate of turn.
Yaw String
One additional tool that can be added to the aircraft is a yaw string. A yaw string is simply a string or piece of yarn attached to the center of the wind screen. When in coordinated flight, the string trails straight back over the top of the wind screen. When the aircraft is either slipping or skidding, the yaw string moves to the right or left depending on the direction of slip or skid.
Instrument Check
During preflight, ensure that the inclinometer is full of fluid and has no air bubbles. The ball should also be resting at its lowest point. When taxiing, the turn coordinator should indicate a turn in the correct direction while the ball moves opposite the direction of the turn.
Attitude Indicator
The attitude indicator, with its miniature aircraft and horizon bar, displays a picture of the attitude of the aircraft. The relationship of the miniature aircraft to the horizon bar is the same as the relationship of the real aircraft to the actual horizon. The instrument gives an instantaneous indication of even the smallest changes in attitude.
The gyro in the attitude indicator is mounted in a horizontal plane and depends upon rigidity in space for its operation. The horizon bar represents the true horizon. This bar is fixed to the gyro and remains in a horizontal plane as the aircraft is pitched or banked about its lateral or longitudinal axis, indicating the attitude of the aircraft relative to the true horizon. [Figure 1-23]
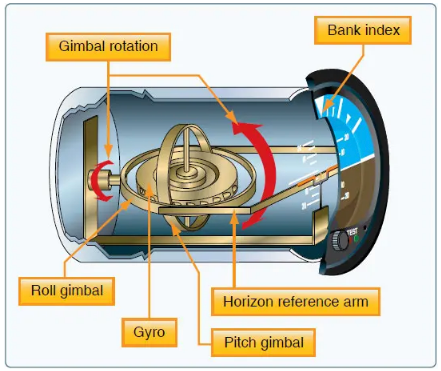
Figure 1-23. Attitude indicator.
The gyro spins in the horizontal plane and resists deflection of the rotational path. Since the gyro relies on rigidity in space, the aircraft actually rotates around the spinning gyro.
An adjustment knob is provided with which the pilot may move the miniature aircraft up or down to align the miniature aircraft with the horizon bar to suit the pilot’s line of vision. Normally, the miniature aircraft is adjusted so that the wings overlap the horizon bar when the aircraft is in straight-andlevel cruising flight.
The pitch and bank limits depend upon the make and model of the instrument. Limits in the banking plane are usually from 100° to 110°, and the pitch limits are usually from 60° to 70°. If either limit is exceeded, the instrument will tumble or spill and will give incorrect indications until realigned. A number of modern attitude indicators do not tumble.
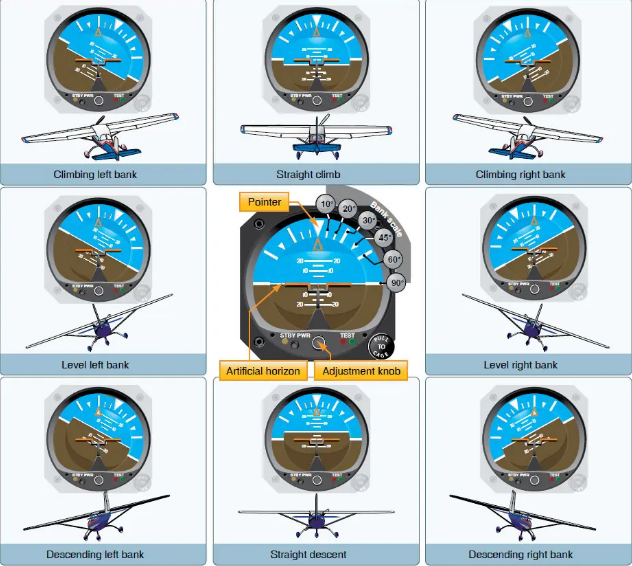
Figure 1-24. Attitude representation by the attitude indicator corresponds to the relation of the aircraft to the real horizon.
Every pilot should be able to interpret the banking scale illustrated in Figure 1-24. Most banking scale indicators on the top of the instrument move in the same direction from that in which the aircraft is actually banked. Some other models move in the opposite direction from that in which the aircraft is actually banked. This may confuse the pilot if the indicator is used to determine the direction of bank. This scale should be used only to control the degree of desired bank. The relationship of the miniature aircraft to the horizon bar should be used for an indication of the direction of bank. The attitude indicator is reliable and the most realistic flight instrument on the instrument panel. Its indications are very close approximations of the actual attitude of the aircraft.
Gyroscopic Flight Instruments
Heading Indicator
The heading indicator is fundamentally a mechanical instrument designed to facilitate the use of the magnetic compass. Errors in the magnetic compass are numerous, making straight flight and precision turns to headings difficult to accomplish, particularly in turbulent air. A heading indicator, however, is not affected by the forces that make the magnetic compass difficult to interpret. [Figure 1-25]
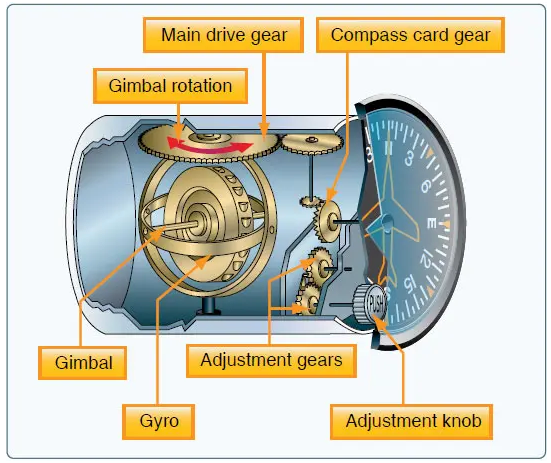
Figure 1-25. A heading indicator displays headings based on a 360° azimuth, with the final zero omitted. For example, “6” represents 060°, while “21” indicates 210°. The adjustment knob is used to align the heading indicator with the magnetic compass.
The operation of the heading indicator depends upon the principle of rigidity in space. The rotor turns in a vertical plane and fixed to the rotor is a compass card. Since the rotor remains rigid in space, the points on the card hold the same position in space relative to the vertical plane of the gyro. The aircraft actually rotates around the rotating gyro, not the other way around. As the instrument case and the aircraft revolve around the vertical axis of the gyro, the card provides clear and accurate heading information.
Because of precession caused by friction, the heading indicator creeps or drifts from its set position. Among other factors, the amount of drift depends largely upon the condition of the instrument. If the bearings are worn, dirty, or improperly lubricated, the drift may be excessive. Another error in the heading indicator is caused by the fact that the gyro is oriented in space, and the Earth rotates in space at a rate of 15° in 1 hour. Thus, discounting precession caused by friction, the heading indicator may indicate as much as 15° error per every hour of operation.
Some heading indicators referred to as horizontal situation indicators (HSI) receive a magnetic north reference from a magnetic slaving transmitter and generally need no adjustment. The magnetic slaving transmitter is called a magnetometer.
Attitude and Heading Reference System (AHRS)
Electronic flight displays have replaced free-spinning gyros with solid-state laser systems that are capable of flight at any attitude without tumbling. This capability is the result of the development of the Attitude and Heading Reference System (AHRS).
The AHRS sends attitude information to the PFD in order to generate the pitch and bank information of the attitude indicator. The heading information is derived from a magnetometer that senses the earth’s lines of magnetic flux. This information is then processed and sent out to the PFD to generate the heading display. [Figure 1-26]
Figure 1-26. Attitude and heading reference system (AHRS).
The Flux Gate Compass System
As mentioned earlier, the lines of flux in the Earth’s magnetic field have two basic characteristics: a magnet aligns with them, and an electrical current is induced, or generated, in any wire crossed by them.
The flux gate compass that drives slaved gyros uses the characteristic of current induction. The flux valve is a small, segmented ring, like the one in Figure 1-27, made of soft iron that readily accepts lines of magnetic flux. An electrical coil is wound around each of the three legs to accept the current induced in this ring by the Earth’s magnetic field. A coil wound around the iron spacer in the center of the frame has 400 Hz alternating current (AC) flowing through it. During the times when this current reaches its peak, twice during each cycle, there is so much magnetism produced by this coil that the frame cannot accept the lines of flux from the Earth’s field.
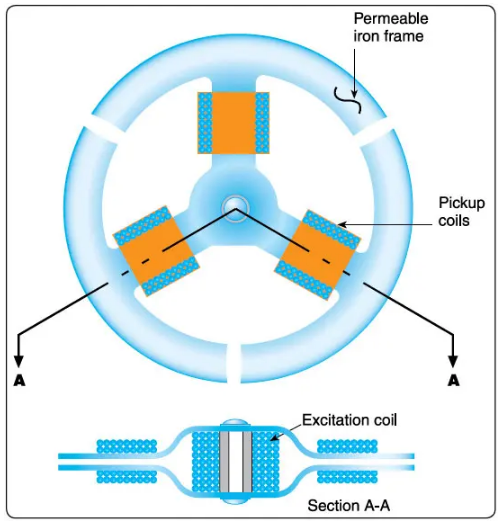
Figure 1-27. The soft iron frame of the flux valve accepts the flux from the Earth’s magnetic field each time the current in the center coil reverses. This flux causes current to flow in the three pickup coils.
As the current reverses between the peaks, it demagnetizes the frame so it can accept the flux from the Earth’s field. As this flux cuts across the windings in the three coils, it causes current to flow in them. These three coils are connected in such a way that the current flowing in them changes as the heading of the aircraft changes. [Figure 1-28]
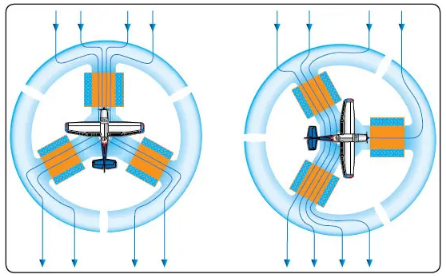
Figure 1-28. The current in each of the three pickup coils changes with the heading of the aircraft.
The three coils are connected to three similar but smaller coils in a synchro inside the instrument case. The synchro rotates the dial of a radio magnetic indicator (RMI) or a HSI.
Remote Indicating Compass
Remote indicating compasses were developed to compensate for the errors and limitations of the older type of heading indicators. The two panel-mounted components of a typical system are the pictorial navigation indicator and the slaving control and compensator unit. [Figure 1-29] The pictorial navigation indicator is commonly referred to as an HSI.
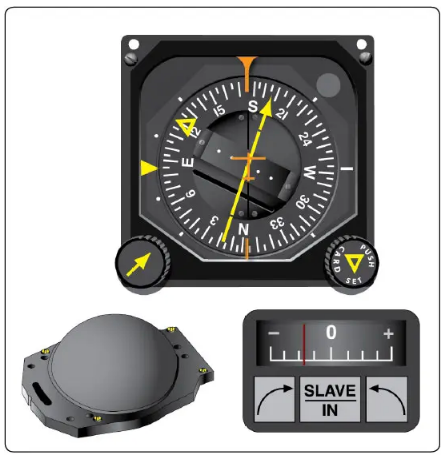
Figure 1-29. Pictorial navigation indicator (HSI, top), slaving meter (lower right), and slaving control compensator unit (lower left).
The slaving control and compensator unit has a push button that provides a means of selecting either the “slaved gyro” or “free gyro” mode. This unit also has a slaving meter and two manual heading-drive buttons. The slaving meter indicates the difference between the displayed heading and the magnetic heading. A right deflection indicates a clockwise error of the compass card; a left deflection indicates a counterclockwise error. Whenever the aircraft is in a turn and the card rotates, the slaving meter shows a full deflection to one side or the other. When the system is in “free gyro” mode, the compass card may be adjusted by depressing the appropriate heading-drive button.
A separate unit, the magnetic slaving transmitter, is mounted remotely, usually in a wingtip to eliminate the possibility of magnetic interference. It contains the flux valve, which is the direction-sensing device of the system. A concentration of lines of magnetic force, after being amplified, becomes a signal relayed to the heading indicator unit, which is also remotely mounted. This signal operates a torque motor in the heading indicator unit that processes the gyro unit until it is aligned with the transmitter signal. The magnetic slaving transmitter is connected electrically to the HSI.
There are a number of designs of the remote indicating compass; therefore, only the basic features of the system are covered here. Instrument pilots must become familiar with the characteristics of the equipment in their aircraft.
As instrument panels become more crowded and the pilot’s available scan time is reduced by a heavier flight deck workload, instrument manufacturers have worked toward combining instruments. One good example of this is the RMI in Figure 1-30. The compass card is driven by signals from the flux valve, and the two pointers are driven by an automatic direction finder (ADF) and a very high frequency (VHF) omni-directional radio range (VOR).
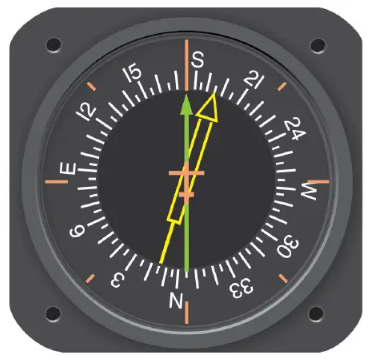
Figure 1-30. Driven by signals from a flux valve, the compass card in this RMI indicates the heading of the aircraft opposite the upper center index mark. The green pointer is driven by the ADF.
Heading indicators that do not have this automatic northseeking capability are called “free” gyros and require periodic adjustment. It is important to check the indications frequently (approximately every 15 minutes) and reset the heading indicator to align it with the magnetic compass when required. Adjust the heading indicator to the magnetic compass heading when the aircraft is straight and level at a constant speed to avoid compass errors.
The bank and pitch limits of the heading indicator vary with the particular design and make of instrument. On some heading indicators found in light aircraft, the limits are approximately 55° of pitch and 55° of bank. When either of these attitude limits is exceeded, the instrument “tumbles” or “spills” and no longer gives the correct indication until reset. After spilling, it may be reset with the caging knob. Many of the modern instruments used are designed in such a manner so that they do not tumble.
An additional precession error may occur due to a gyro not spinning fast enough to maintain its alignment. When the vacuum system stops producing adequate suction to maintain the gyro speed, the heading indicator and the attitude indicator gyros begin to slow down. As they slow, they become more susceptible to deflection from the plane of rotation. Some aircraft have warning lights to indicate that a low vacuum situation has occurred. Other aircraft may have only a vacuum gauge that indicates the suction.
Instrument Check
As the gyro spools up, make sure there are no abnormal sounds. While taxiing, the instrument should indicate turns in the correct direction, and precession should be normal. At idle power settings, the gyroscopic instruments using the vacuum system might not be up to operating speeds and precession might occur more rapidly than during flight.
Angle of Attack Indicators
The purpose of an AOA indicator is to give the pilot better situational awareness pertaining to the aerodynamic health of the airfoil. This can also be referred to as stall margin awareness. More simply explained, it is the margin that exists between the current AOA that the airfoil is operating at, and the AOA at which the airfoil will stall (critical AOA).
Speed by itself is not a reliable parameter to avoid a stall. An airplane can stall at any speed. Angle of attack is a better parameter to use to avoid a stall. For a given configuration, the airplane always stalls at the same AOA, referred to as the critical AOA. This critical AOA does not change with:
-
Weight
-
Bank Angle
-
Temperature
-
Density Altitude
-
Center of Gravity
An AOA indicator can have several benefits when installed in General Aviation aircraft, not the least of which is increased situational awareness. Without an AOA indicator, the AOA is “invisible” to pilots. These devices measure several parameters simultaneously and determine the current AOA providing a visual image to the pilot of the current AOA along with representations of the proximity to the critical AOA. [Figure 1-31] These devices can give a visual representation of the energy management state of the airplane. The energy state of an airplane is the balance between airspeed, altitude, drag, and thrust and represents how efficiently the airfoil is operating.
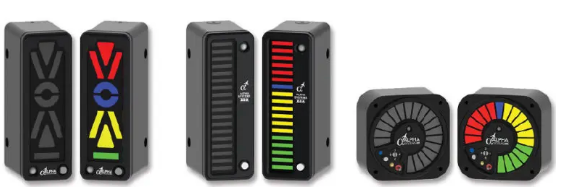
Figure 1-31. Angle of attack indicators.
Aircraft Compass Systems
The Earth is a huge magnet, spinning in space, surrounded by a magnetic field made up of invisible lines of flux. These lines leave the surface at the magnetic North Pole and reenter at the magnetic South Pole.
Lines of magnetic flux have two important characteristics: any magnet that is free to rotate will align with them, and an electrical current is induced into any conductor that cuts across them. Most direction indicators installed in aircraft make use of one of these two characteristics.
Magnetic Compass Systems
One of the oldest and simplest instruments for indicating direction is the magnetic compass. It is also one of the basic instruments required by Title 14 of the Code of Federal Regulations (14 CFR) part 91 for both VFR and IFR flight.
A magnet is a piece of material, usually a metal containing iron, that attracts and holds lines of magnetic flux. Regardless of size, every magnet has two poles: north and south. When one magnet is placed in the field of another, the unlike poles attract each other, and like poles repel.
An aircraft magnetic compass, such as the one in Figure 1-32, has two small magnets attached to a metal float sealed inside a bowl of clear compass fluid similar to kerosene. A graduated scale, called a card, is wrapped around the float and viewed through a glass window with a lubber line across it. The card is marked with letters representing the cardinal directions, north, east, south, and west, and a number for each 30° between these letters. The final “0” is omitted from these directions. For example, 3 = 30°, 6 = 60°, and 33 = 330°. There are long and short graduation marks between the letters and numbers, each long mark representing 10° and each short mark representing 5°.
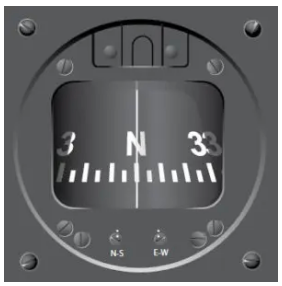
Figure 1-32. A magnetic compass. The vertical line is called the lubber line.
The float and card assembly has a hardened steel pivot in its center that rides inside a special, spring-loaded, hard glass jewel cup. The buoyancy of the float takes most of the weight off of the pivot, and the fluid damps the oscillation of the float and card. This jewel-and-pivot type mounting allows the float freedom to rotate and tilt up to approximately 18° angle of bank. At steeper bank angles, the compass indications are erratic and unpredictable.
The compass housing is entirely full of compass fluid. To prevent damage or leakage when the fluid expands and contracts with temperature changes, the rear of the compass case is sealed with a flexible diaphragm, or with a metal bellows in some compasses.
The magnets align with the Earth’s magnetic field and the pilot reads the direction on the scale opposite the lubber line. Note that in Figure 1-32, the pilot views the compass card from its backside. When the pilot is flying north, as the compass indicates, east is to the pilot’s right. On the card, “33,” which represents 330° (west of north), is to the right of north. The reason for this apparent backward graduation is that the card remains stationary, and the compass housing and the pilot rotate around it. Because of this setup, the magnetic compass can be confusing to read.
Magnetic Compass Induced Errors
The magnetic compass is the simplest instrument in the panel, but it is subject to a number of errors that must be considered.
Variation
The Earth rotates about its geographic axis; maps and charts are drawn using meridians of longitude that pass through the geographic poles. Directions measured from the geographic poles are called true directions. The magnetic North Pole to which the magnetic compass points is not collocated with the geographic North Pole, but is some 1,300 miles away; directions measured from the magnetic poles are called magnetic directions. In aerial navigation, the difference between true and magnetic directions is called variation. This same angular difference in surveying and land navigation is called declination.
Figure 1-33 shows the isogonic lines that identify the number of degrees of variation in their area. The line that passes near Chicago is called the agonic line. Anywhere along this line the two poles are aligned, and there is no variation. East of this line, the magnetic North Pole is to the west of the geographic North Pole and a correction must be applied to a compass indication to get a true direction.
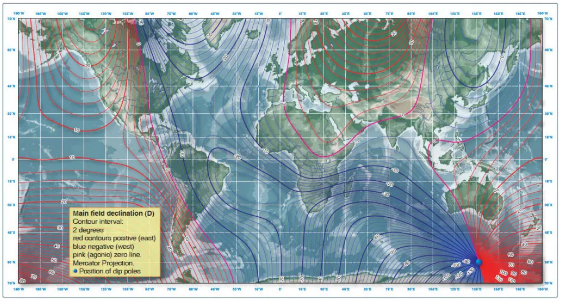
Figure 1-33. Isogonic lines are lines of equal variation.
Flying in the Washington, D.C., area, for example, the variation is 10° west. If a pilot wants to fly a true course of south (180°), the variation must be added to this, resulting in a magnetic course of 190° to fly. Flying in the Los Angeles, California area, the variation is 14° east. To fly a true course of 180° there, the pilot would have to subtract the variation and fly a magnetic course of 166°. The variation error does not change with the heading of the aircraft; it is the same anywhere along the isogonic line.
Deviation
The magnets in a compass align with any magnetic field. Some causes for magnetic fields in aircraft include flowing electrical current, magnetized parts, and conflict with the Earth’s magnetic field. These aircraft magnetic fields create a compass error called deviation.
Deviation, unlike variation, depends on the aircraft heading. Also unlike variation, the aircraft’s geographic location does not affect deviation. While no one can reduce or change variation error, an aviation maintenance technician (AMT) can provide the means to minimize deviation error by performing the maintenance task known as “swinging the compass.”
To swing the compass, an AMT positions the aircraft on a series of known headings, usually at a compass rose. [Figure 1-34] A compass rose consists of a series of lines marked every 30° on an airport ramp, oriented to magnetic north. There is minimal magnetic interference at the compass rose. The pilot or the AMT, if authorized, can taxi the aircraft to the compass rose and maneuver the aircraft to the headings prescribed by the AMT.
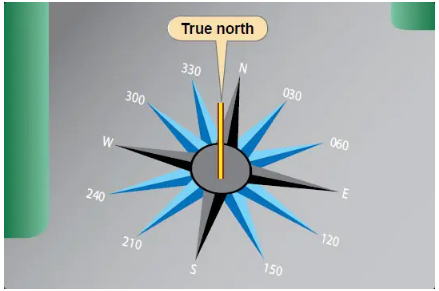
Figure 1-34. Utilization of a compass rose aids compensation for deviation errors.
As the aircraft is “swung” or aligned to each compass rose heading, the AMT adjusts the compensator assembly located on the top or bottom of the compass. The compensator assembly has two shafts whose ends have screwdriver slots accessible from the front of the compass. Each shaft rotates one or two small compensating magnets. The end of one shaft is marked E-W, and its magnets affect the compass when the aircraft is pointed east or west. The other shaft is marked N-S and its magnets affect the compass when the aircraft is pointed north or south.
The adjustments position the compensating magnets to minimize the difference between the compass indication and the actual aircraft magnetic heading. The AMT records any remaining error on a compass correction card like the one in Figure 8-35 and places it in a holder near the compass. Only AMTs can adjust the compass or complete the compass correction card. Pilots determine and fly compass headings using the deviation errors noted on the card. Pilots must also note the use of any equipment causing operational magnetic interference such as radios, deicing equipment, pitot heat, radar, or magnetic cargo.
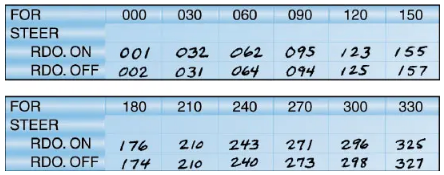
Figure 1-35. A compass correction card shows the deviation correction for any heading.
The corrections for variation and deviation must be applied in the correct sequence as shown below, starting from the true course desired.
Step
1: Determine the Magnetic Course
True Course (180°) ±
Variation (+10°) = Magnetic Course (190°)
The magnetic course (190°) is steered if there is no deviation error to be applied. The compass card must now be considered for the compass course of 190°.
Step
2: Determine the Compass Course
Magnetic Course (190°, from
step 1) ± Deviation (–2°, from correction card) = Compass Course
(188°)
NOTE: Intermediate magnetic courses between those listed on the compass card need to be interpreted. Therefore, to steer a true course of 180°, the pilot would follow a compass course of 188°.
To find the true course that is being flown when the compass course is known:
Compass Course ± Deviation = Magnetic Course ± Variation = True Course
Aircraft Compass Systems
Dip Errors
The Earth’s magnetic field runs parallel to its surface only at the Magnetic Equator, which is the point halfway between the Magnetic North and South Poles. As you move away from the Magnetic Equator towards the magnetic poles, the angle created by the vertical pull of the Earth’s magnetic field in relation to the Earth’s surface increases gradually. This angle is known as the dip angle. The dip angle increases in a downward direction as you move towards the Magnetic North Pole and increases in an upward direction as you move towards the Magnetic South Pole.
If the compass needle were mounted so that it could pivot freely in three dimensions, it would align itself with the magnetic field, pointing up or down at the dip angle in the direction of local Magnetic North. Because the dip angle is of no navigational interest, the compass is made so that it can rotate only in the horizontal plane. This is done by lowering the center of gravity below the pivot point and making the assembly heavy enough that the vertical component of the magnetic force is too weak to tilt it significantly out of the horizontal plane. The compass can then work effectively at all latitudes without specific compensation for dip. However, close to the magnetic poles, the horizontal component of the Earth’s field is too small to align the compass which makes the compass unusable for navigation. Because of this constraint, the compass only indicates correctly if the card is horizontal. Once tilted out of the horizontal plane, it will be affected by the vertical component of the Earth’s field which leads to the following discussions on northerly and southerly turning errors.
Northerly Turning Errors
The center of gravity of the float assembly is located lower than the pivotal point. As the aircraft turns, the force that results from the magnetic dip causes the float assembly to swing in the same direction that the float turns. The result is a false northerly turn indication. Because of this lead of the compass card, or float assembly, a northerly turn should be stopped prior to arrival at the desired heading. This compass error is amplified with the proximity to either magnetic pole. One rule of thumb to correct for this leading error is to stop the turn 15 degrees plus half of the latitude (i.e., if the aircraft is being operated in a position near 40 degrees latitude, the turn should be stopped 15+20=35 degrees prior to the desired heading). [Figure 1-36A]
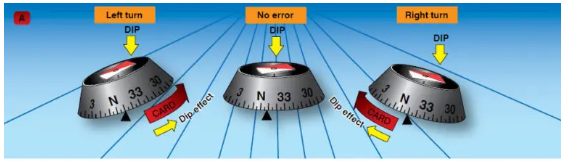
Figure 1-36A. Northerly turning errors.
Southerly Turning Errors
When turning in a southerly direction, the forces are such that the compass float assembly lags rather than leads. The result is a false southerly turn indication. The compass card, or float assembly, should be allowed to pass the desired heading prior to stopping the turn. As with the northerly error, this error is amplified with the proximity to either magnetic pole. To correct this lagging error, the aircraft should be allowed to pass the desired heading prior to stopping the turn. The same rule of 15 degrees plus half of the latitude applies here (i.e., if the aircraft is being operated in a position near 30 degrees latitude, the turn should be stopped 15+15+30 degrees after passing the desired heading). [Figure 1-36B]
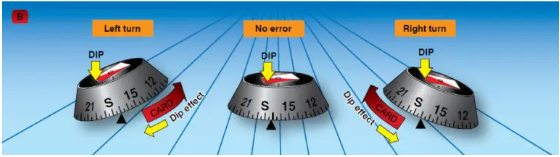
Figure 1-36B. Southerly turning errors.
Acceleration Errors
The magnetic dip and the forces of inertia cause magnetic compass errors when accelerating and decelerating on easterly and westerly headings. Because of the penduloustype mounting, the aft end of the compass card is tilted upward when accelerating and downward when decelerating during changes of airspeed. When accelerating on either an easterly or westerly heading, the error appears as a turn indication toward north. When decelerating on either of these headings, the compass indicates a turn toward south. A mnemonic, or memory jogger, for the effect of acceleration error is the word “ANDS” (Acceleration- North/Deceleration-South) may help you to remember the acceleration error. [Figure 1-37] Acceleration causes an indication toward north; deceleration causes an indication toward south.
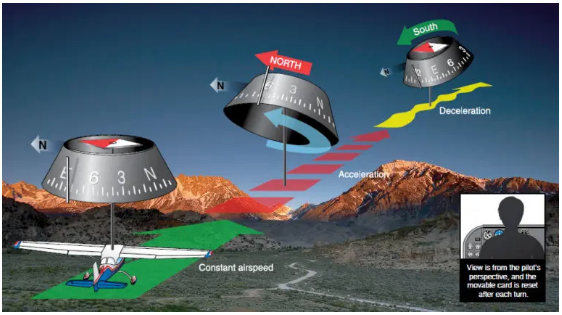
Figure 1-37. The effects of acceleration error.
Oscillation Errors
Oscillation is a combination of all of the errors previously mentioned and results in fluctuation of the compass card in relation to the actual heading direction of the aircraft. When setting the gyroscopic heading indicator to agree with the magnetic compass, use the average indication between the swings.
The Vertical Card Magnetic Compass
The vertical card magnetic compass eliminates some of the errors and confusion encountered with the magnetic compass. The dial of this compass is graduated with letters representing the cardinal directions, numbers every 30°, and tick marks every 5°. The dial is rotated by a set of gears from the shaft-mounted magnet, and the nose of the symbolic aircraft on the instrument glass represents the lubber line for reading the heading of the aircraft from the dial. [Figure 1-38]
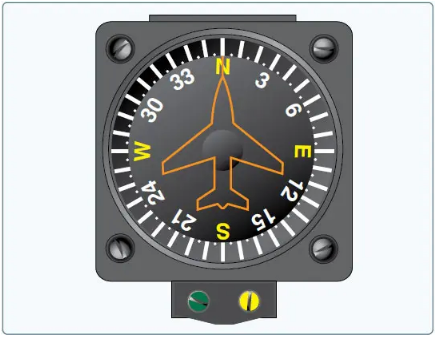
Figure 1-38. Vertical card magnetic compass.
Lags or Leads
When starting a turn from a northerly heading, the compass lags behind the turn. When starting a turn from a southerly heading, the compass leads the turn.
Eddy Current Damping
In the case of a vertical card magnetic compass, flux from the oscillating permanent magnet produces eddy currents in a damping disk or cup. The magnetic flux produced by the eddy currents opposes the flux from the permanent magnet and decreases the oscillations.